Aug. 09, 2013
I started to use Evernote since around 2011. Recently the number of notes in my Evernote account has surpassed 5000. To celebrate this milestone, I wrote some python scripts to visualize my evernotes.
The easiest way to get the Evernote data out is to use the official clients. Both the windows and the Mac Evernote official client can export data in ENEX format. Unfortunately, the development team of Evernote decides not to develop any linux client in the near future, which makes the data export in linux very hard. It may be possible to get the data out using the cloud APIs. But requesting an API key is too cumbersome for this small project.
Although it is the most convenient way, exporting data in ENEX format still has two pitfalls:
First, ENEX is a customized xml format, and it contains some characters, particularly ‘ ’, that cannot be correctly recognized by lxml module in python. To address it, I wrote a script (XMLTOJson.py) to convert ENEX files to regular JSON files.
Second, ENEX file doesn’t provide information about the notebook a note belongs to. Fortunately, the Windows client provides a command-line program ENScript.exe that can export notebooks separately. I wrote a powershell script (export_evernote.ps1) to export the notebooks into a folder, in which each ENEX file corresponds to a notebook. Again I used XMLTOJson.py to convert the ENEX files in the folder into JSON files.
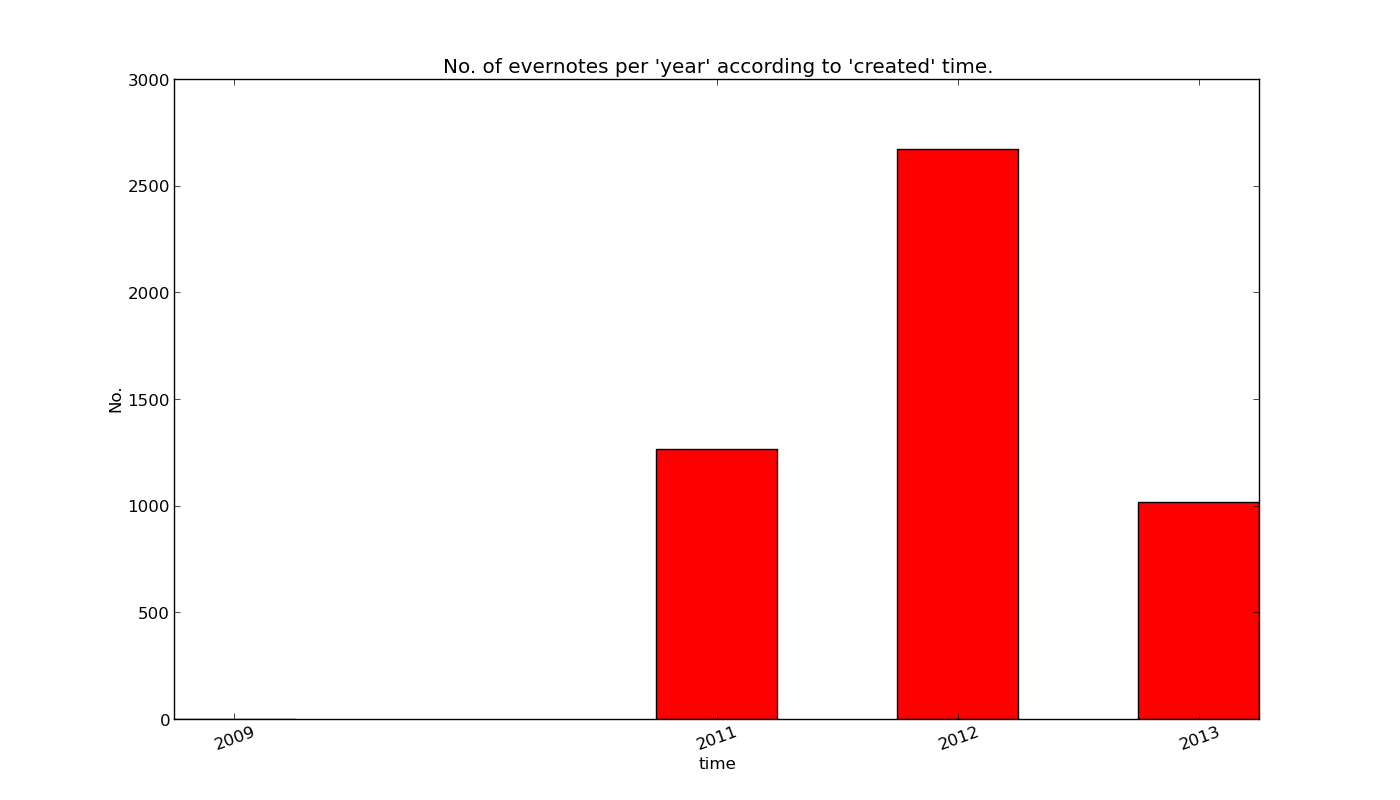
Each note is associated with two timestamps–1. the ‘Created’ time and 2. the last ‘Updated’ time.
Here is a plot of the number of notes I created in each year. Considering that only 7 months is covered, the total number for 2013 should be around 2000. From the plot, I was the most addicted to Evernote in 2012, during which I created over 2500 notes.
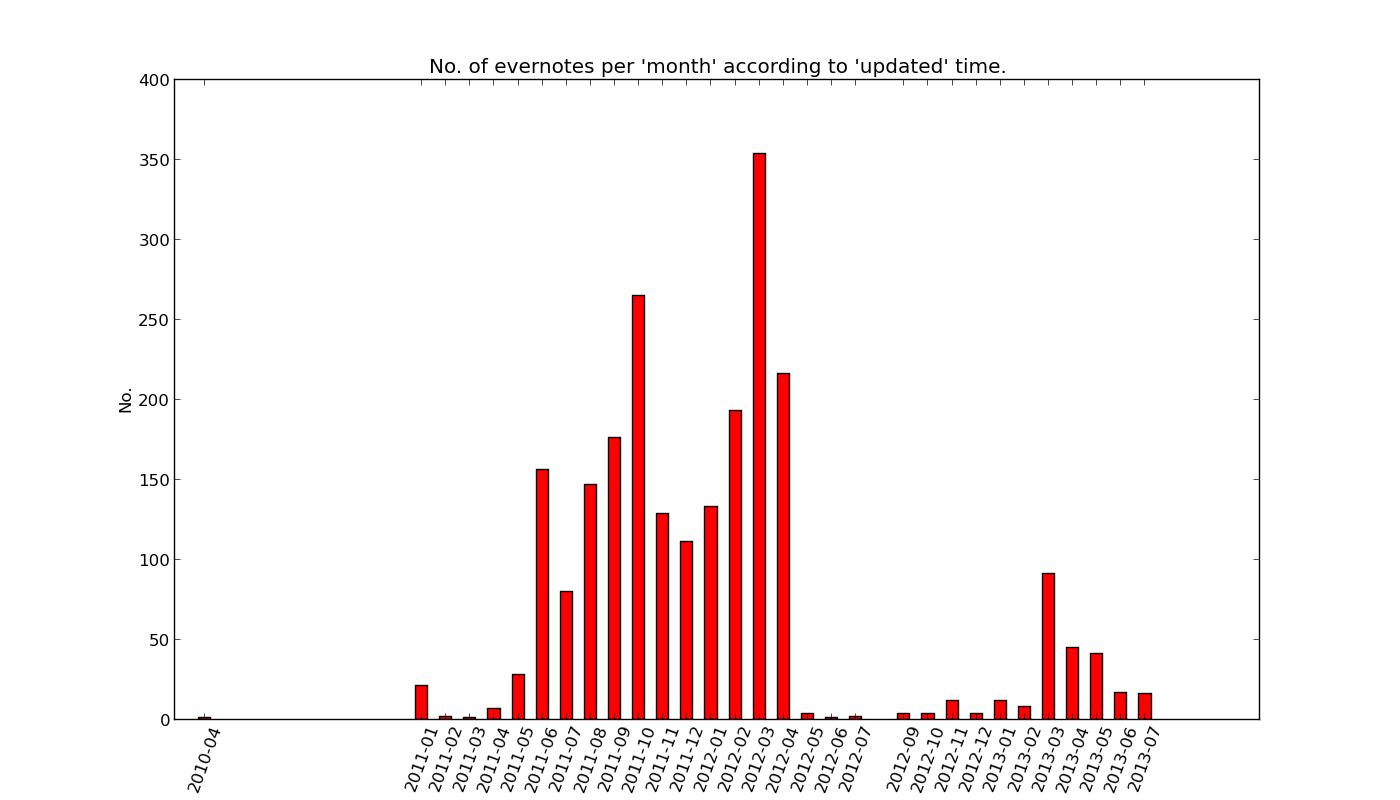
The following plot is the number of evernotes I updated in each year. The number of ‘updated’ notes was high in 2011, whereas the number is decreasing over the past two years. In 2011 and the first half of 2012, I used a Mac Evernote client in my Macbook pro. After that, I switched to a Thinkpad x230 with Ubuntu 12.04, in which the only usable option is the web application (www.evernote.com). Updating notes using Mac client is much easier than the web application, which may explain my decrease of note updates.
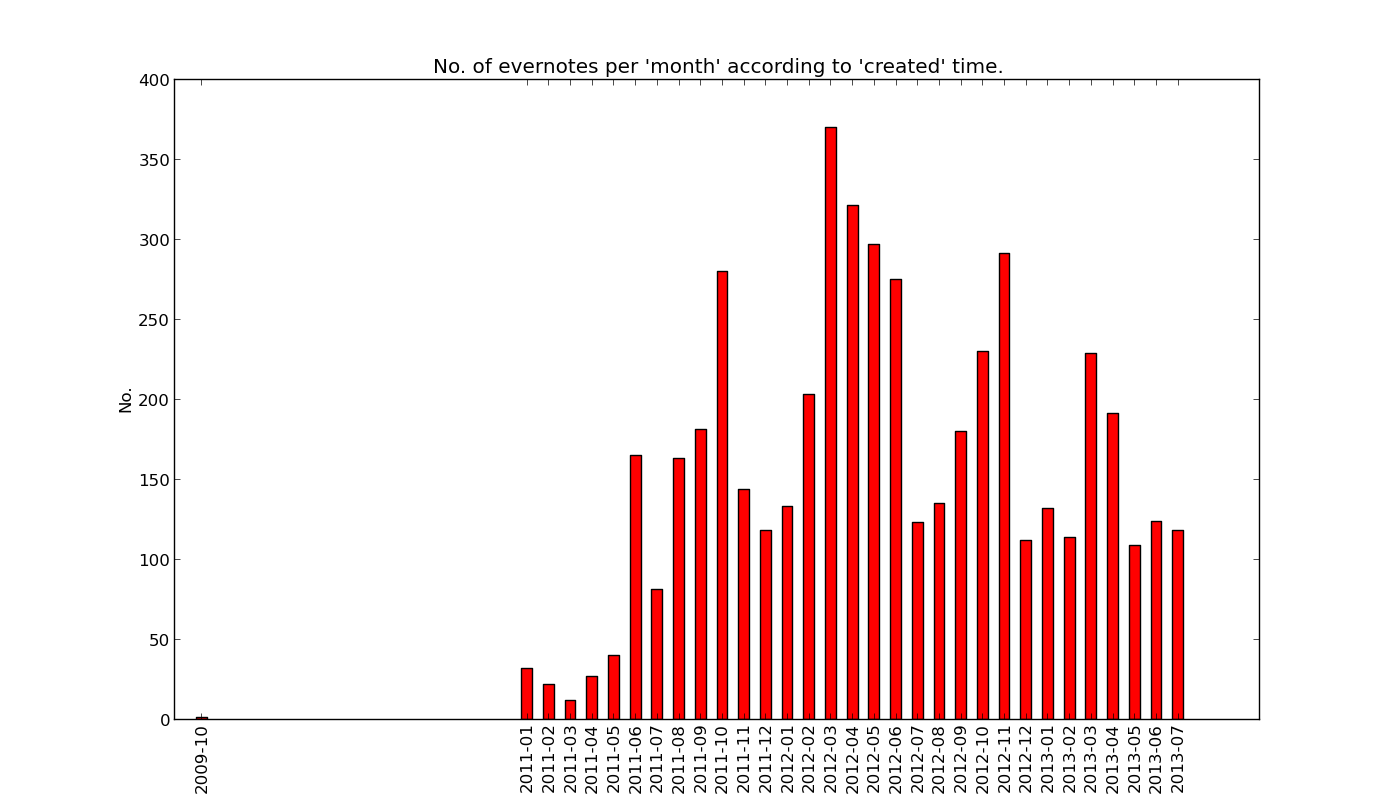
The following plot visualizes the number of notes I created in every month. There is a welcome note whose ‘created’ timestamp is Oct. 19, 2009. However, I signed up Evernote in Jan. 7, 2011. Why the ‘created’ time for this welcome note is Oct. 19, 2009? I guess this date is the birthdate of Evernote, and the ‘created’ timestamp was deliberately set as the birthdate of Evernote.
The following figure is the number of ‘updated’ notes in every month. Obviously, I suddenly stopped to update notes from May 2015, which matches the time I switched from Mac to Ubuntu. The updates were somewhat recovered since Mar. 2013, because I began to use Evernote as my GTD engines. I need to update my task lists and checklists.
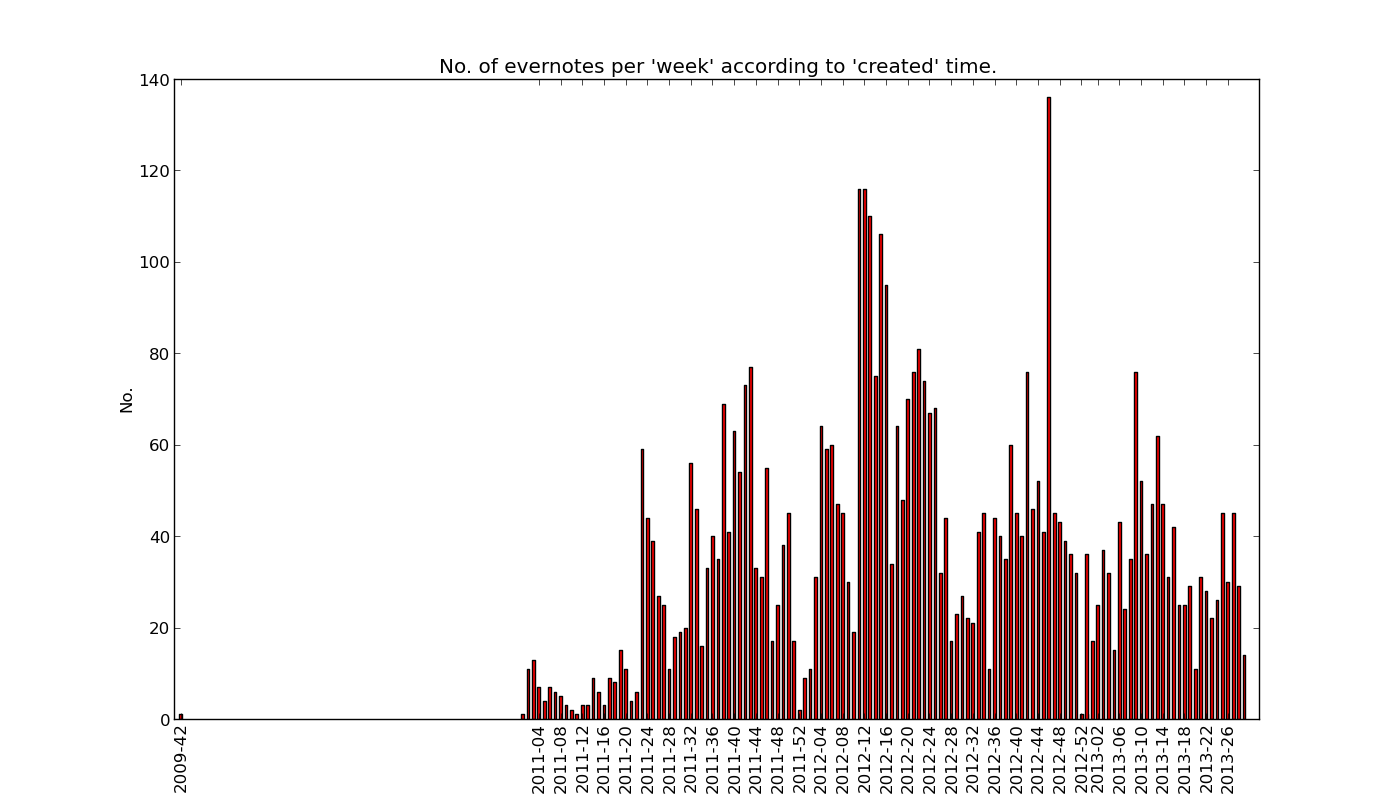
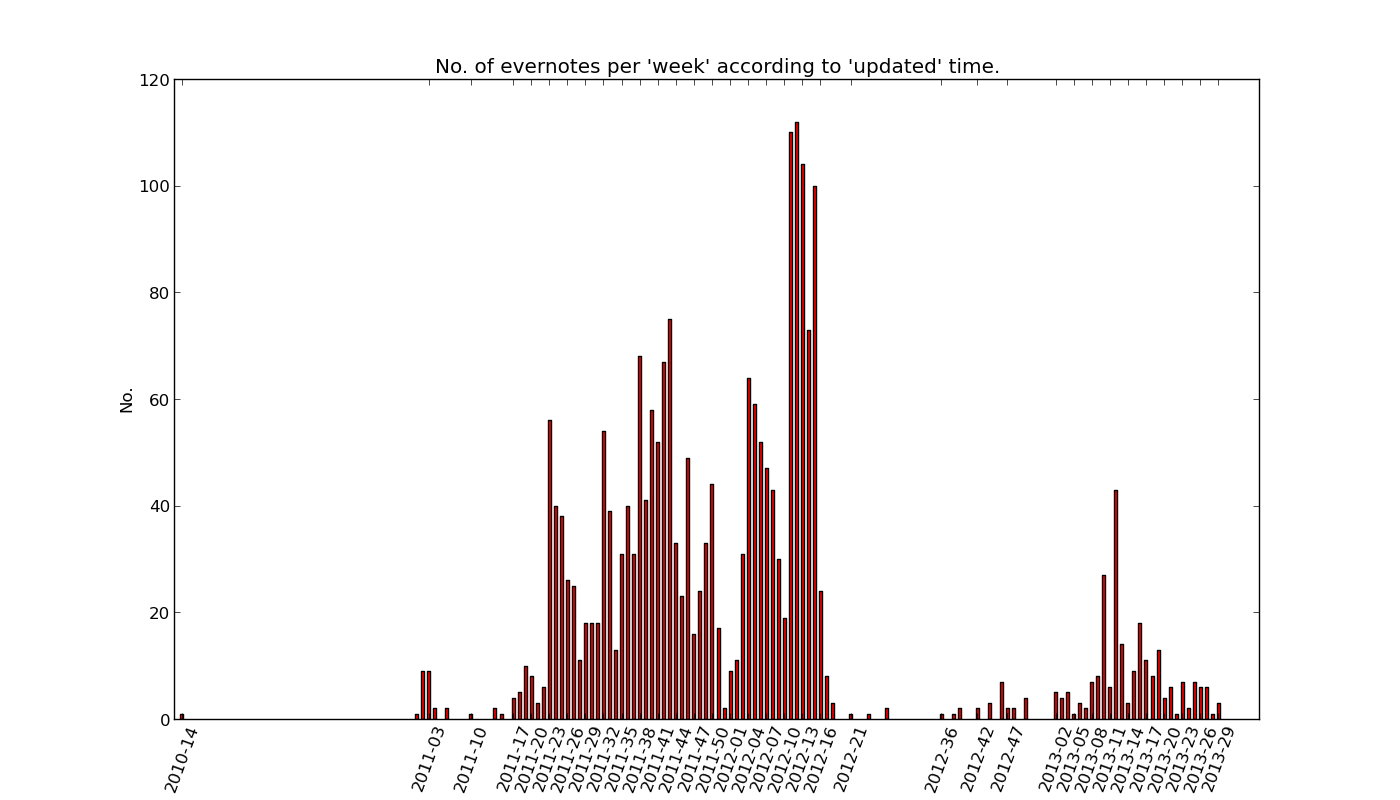
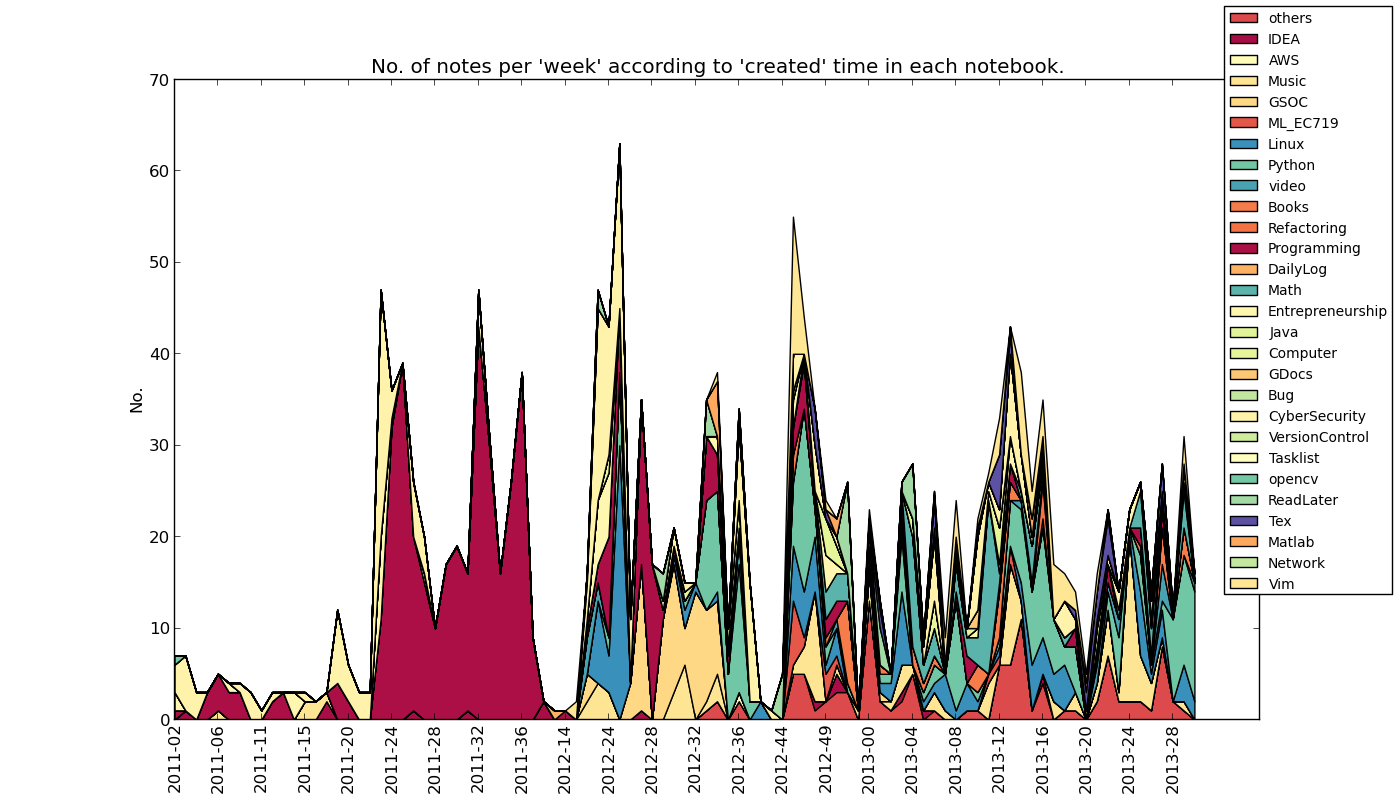
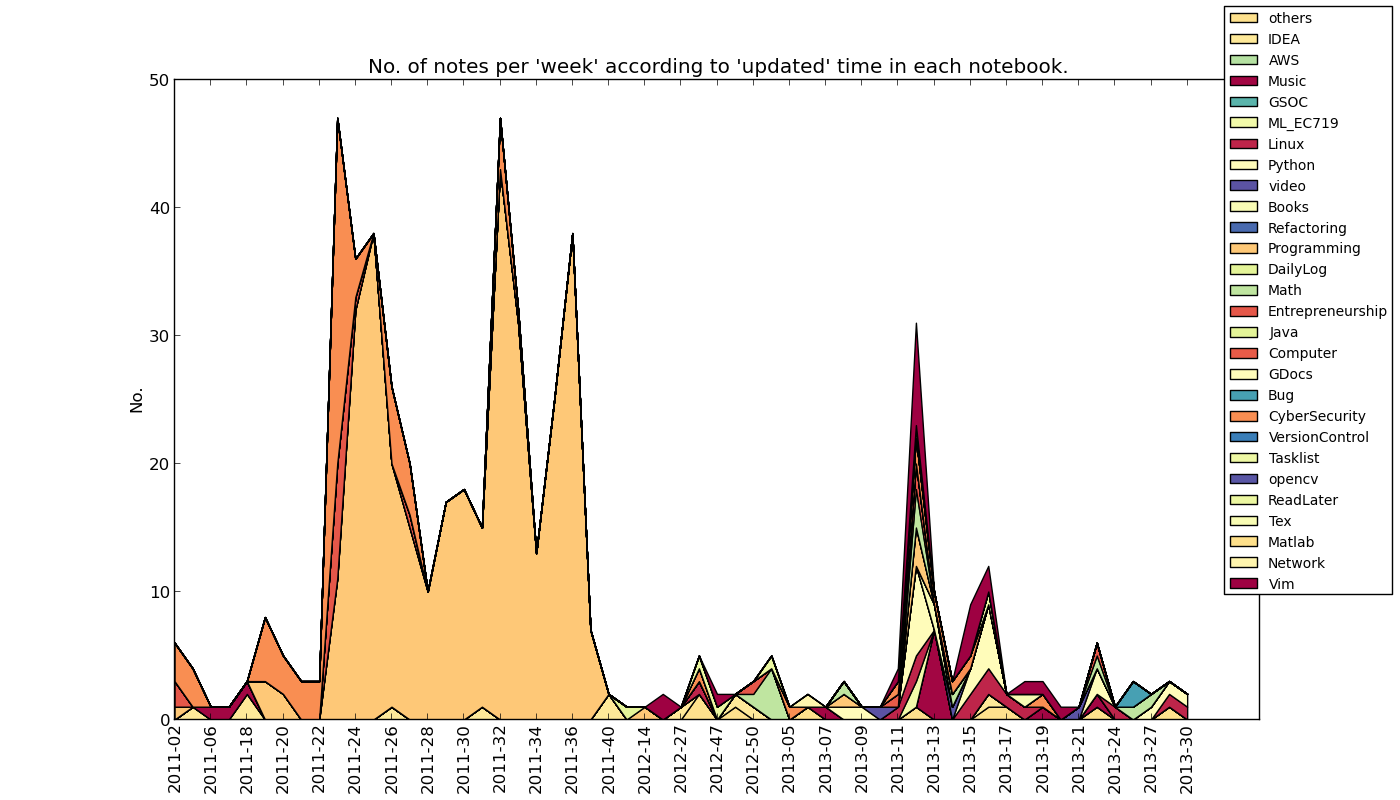
The following two plots visualize the ‘created’ notes and ‘updated’ notes in week level. The number of ‘created’ and ‘updated’ notes during the 12th-14th weeks of 2012 are soaring. During this time, I was busily preparing for the application of Google Summer of Code 2012. The efforts paid off, I was finally selected into Google Summer of Code 2012 in which I had a very wonderful experience.
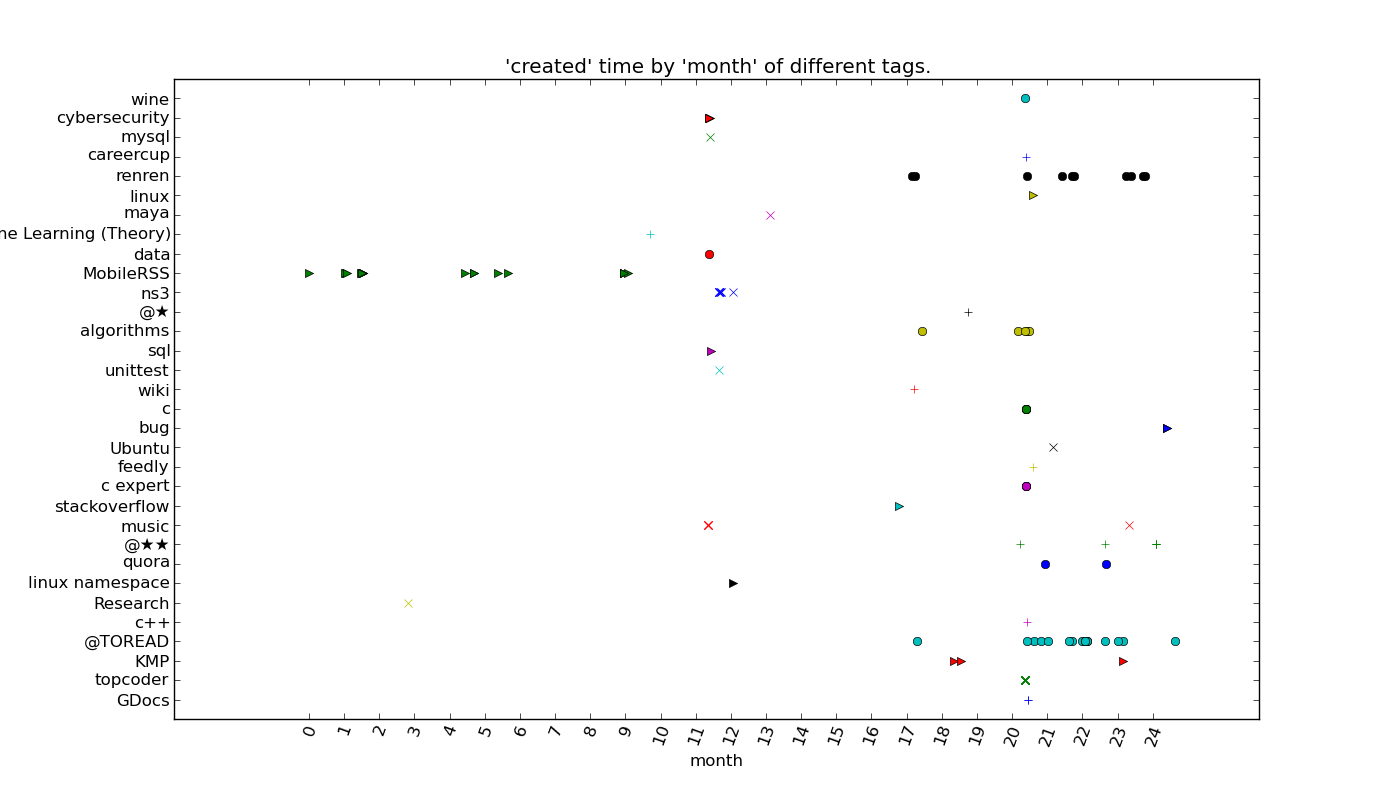
Evernote provides a feature to tag notes. For each note, you can add as many tags as you like. Usually I don’t use this feature manually, but when I clip notes from my mobile phone and RSS reader, which I often do, tags will be added automatically. The following figure shows the time of tagged notes. The x-axis is the ‘created’ time and each y-coordinate corresponds to a tag.
I was heavily addicted to Google Reader (GR) when it was alive. In 2011, I often read GR in my iphone using MobileRSS, which added ‘MobileRSS’ tags when I clipped articles. Later, I was irritated when the app asked me to pay the second time after I upgraded to a newer IOS, ignoring that I had already purchased a pro version. As a result, I switched to Newsfy, which does not add tags automatically. After GR was shutted down in July, I switched to feedly together with many other disappointed GR users.
From 2012, I started to add tags manually. One missing feature in Evernote is to assign importance to each note like gmail. I emulated this feature by tag notes with @TOREAD, @✭ and @✭✭.
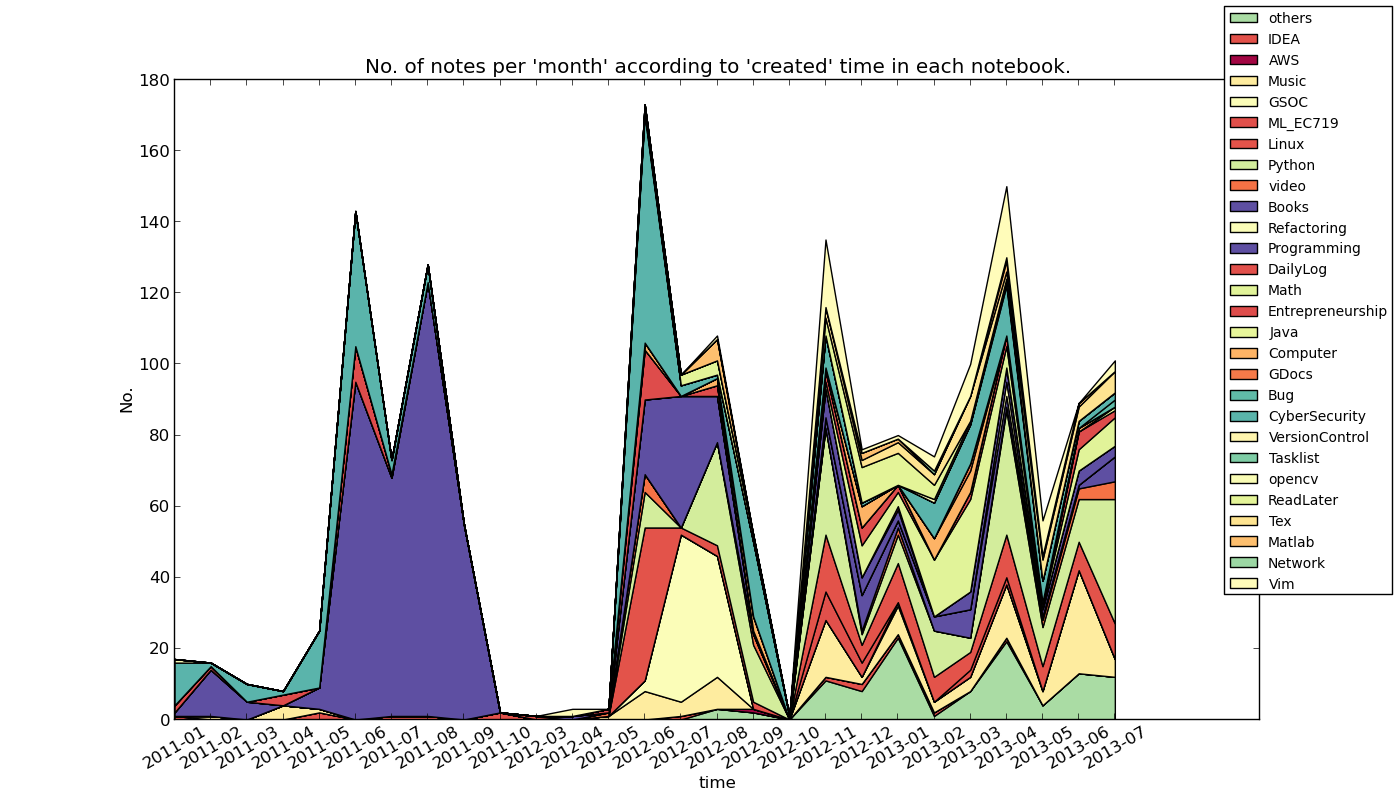
In Evernote, a notebook is a collection of individual notes. The following figure shows a stacked area graph of numbers of noted I created in each month. I started to use notebook feature systematically after April 2012. Before April, 2012, I mostly used evernote as an archive of web pages and dump most of notes into one notebook. ‘Programming’ is one of the first notebooks I created, which was divided into more sophisticated categories later.
The ‘cybersecurity’ notebook, which is related to my research, dominated in May and the beginning of June of 2012. From May, 2012 to Aug 2012, my focus shifted to ‘GSOC’ , ‘Programming’ and ‘Python’, which dued to my participation of Google Summer of Code 2012.
There is a visible gap in Sep, 2012 when I had a vacation to recover from demanding work in the summer (that summer was very busy for me). I am a fan of classical music. Even in this busy summer, there were still a considerably large number of ‘Music’ notes. The ‘GSOC’ notebook disappeared after the google summer of code officially ended at Sep. 2012. Considering the number of created notes, the four notebooks I used the most are ‘Python’, ‘Linux’, ‘Music’, and ‘others’. The ‘others’ notebook was created in June, 2013 to store miscellaneous notes.
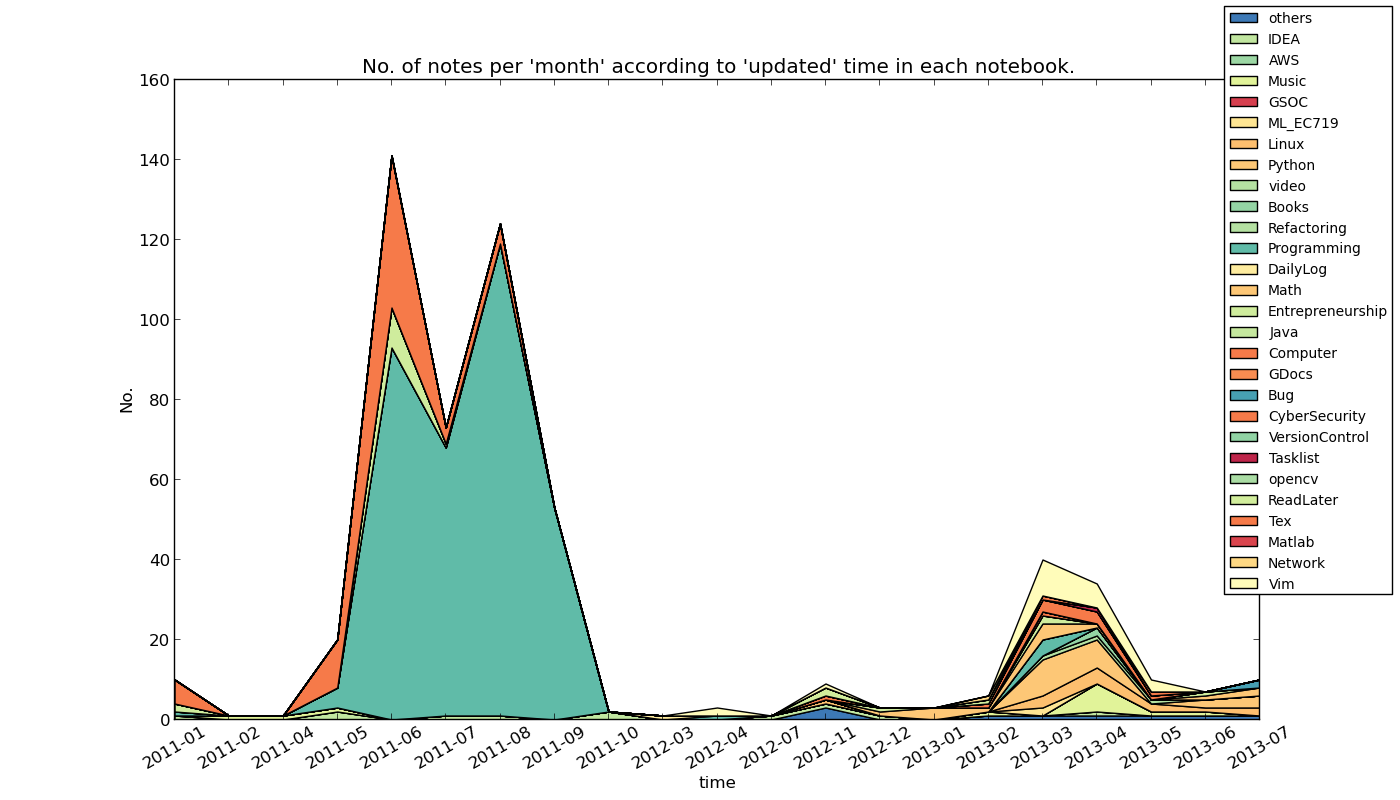
The following figure shows the number of ‘updated’ notes in every month for each notebook. An interesting observation is that few notes in the ‘others’ notebook is updated despite its considerable large size. This observation indicates that I rarely review the notes in ‘others’ notebook. This bad habit should be improved in the future.
The following two figures show the number of ‘created’ and ‘updated’ notes in every week for each notebook. For most notebooks, although the number of ‘created’ notes doesn’t change significantly, the number of ‘updated’ notes increased rapidly in the 12th week of 2013. The reason is that I categorized many notes manually in that week.
The blog is inspired by Stephen Wolfram’s blog: The Personal Analytics of My Life.
I fully agree with Mr. Wolfram that personal data is very useful and everyone should log their own life as much as possible. Evernote is a good tool to achieve this goal.
Surely there is more information I can dig out. But the information in this article provides a good starting point. The source code of this project is available at:
https://github.com/hbhzwj/VizEvernote
If you are interested, you can try to analyze your Evernote data using these codes. Any suggestion, bugfix or improvement is welcomed.
